Get ready for another round of supply chain bottlenecks
ARTICLE | June 07, 2022
Authored by RSM US LLP
The monthslong lockdown in Shanghai, China's most populous city and home to the world's largest container port, was only recently lifted but still caused a pileup of ships that anchor off the Chinese coast. Factory shutdowns and the reduced flow of goods from the city's port will cause another jolt to U.S. supply chains in the weeks and months to come.
The predictable knock-on effects of the Shanghai lockdown—while far from a total supply disruption akin to that of the early days of the pandemic—will certainly sustain or worsen supply shortages and sustain worldwide inflation.
What's happening now?
On March 28, the Chinese government began locking down the port and the city of Shanghai to stem the spread of COVID-19. The port and, subsequently, several factories were placed in a "closed-loop" system that requires workers to sleep at their place of work or bus to and from hard-to-find hotels already booked by out-of-town health care workers.
Some factories received approval to reopen, but they and the port were not functioning at full capacity because of the logistical hurdles of sheltering, transporting and feeding workers as COVID-19 prevention measures remain in place.
In addition to ships piling up near the port, inventory overload is becoming an issue. According to the National Bureau of Statistics of China, the April 30 logistic logjams sent stockpiles of finished goods in China to a high not seen since summer 2012. Also, in April, the Port of Shanghai ran out of space for refrigerated containers, which forced shippers to store them off-site, creating additional delays.
April's container throughput in Shanghai dropped 24% month over month to 308,500 units—a low beaten only in February 2020, when the port usually experiences its seasonal low. Some shipments leaving Shanghai were diverted to the smaller Port of Ningbo-Zhoushan, which can't handle Shanghai's volume and acts only as a stopgap.
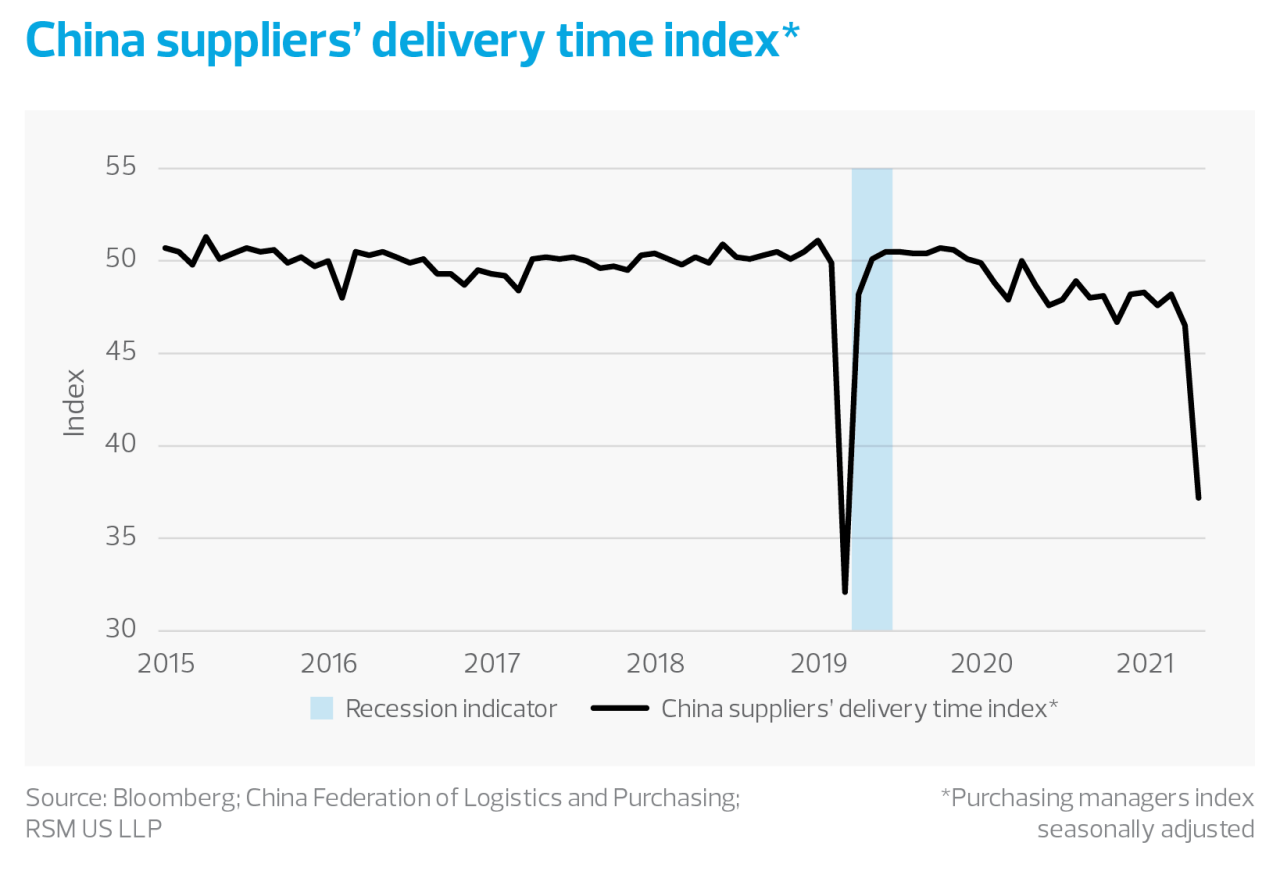
In early April, the time a shipping container spent at the Port of Shanghai was over 10 days, up from the typical one or two, according to the logistics data tracker FreightWaves. In addition, the China Purchasing Managers Index, a measure of suppliers' delivery time, was tracking to lows not seen since the early stage of the pandemic, characterized by toilet paper shortages and other supply crunches. These trends signal a dearth of stock in the United States later this year.
What happens next?
When Chinese lockdowns lift, manufacturers and shipping companies will compensate for disruptions and strive for peak output, resulting in a whipsaw of production and shipping. That will hold for the current situation. Another wave of container ships will sail across the Pacific to meet those currently loitering just over the horizon of the U.S. West Coast, awaiting their opportunity to anchor in San Pedro Bay or occupy a berth. The expected dip in output from the lockdown of China's port cities will be followed by another spike in already-elevated U.S. container traffic.
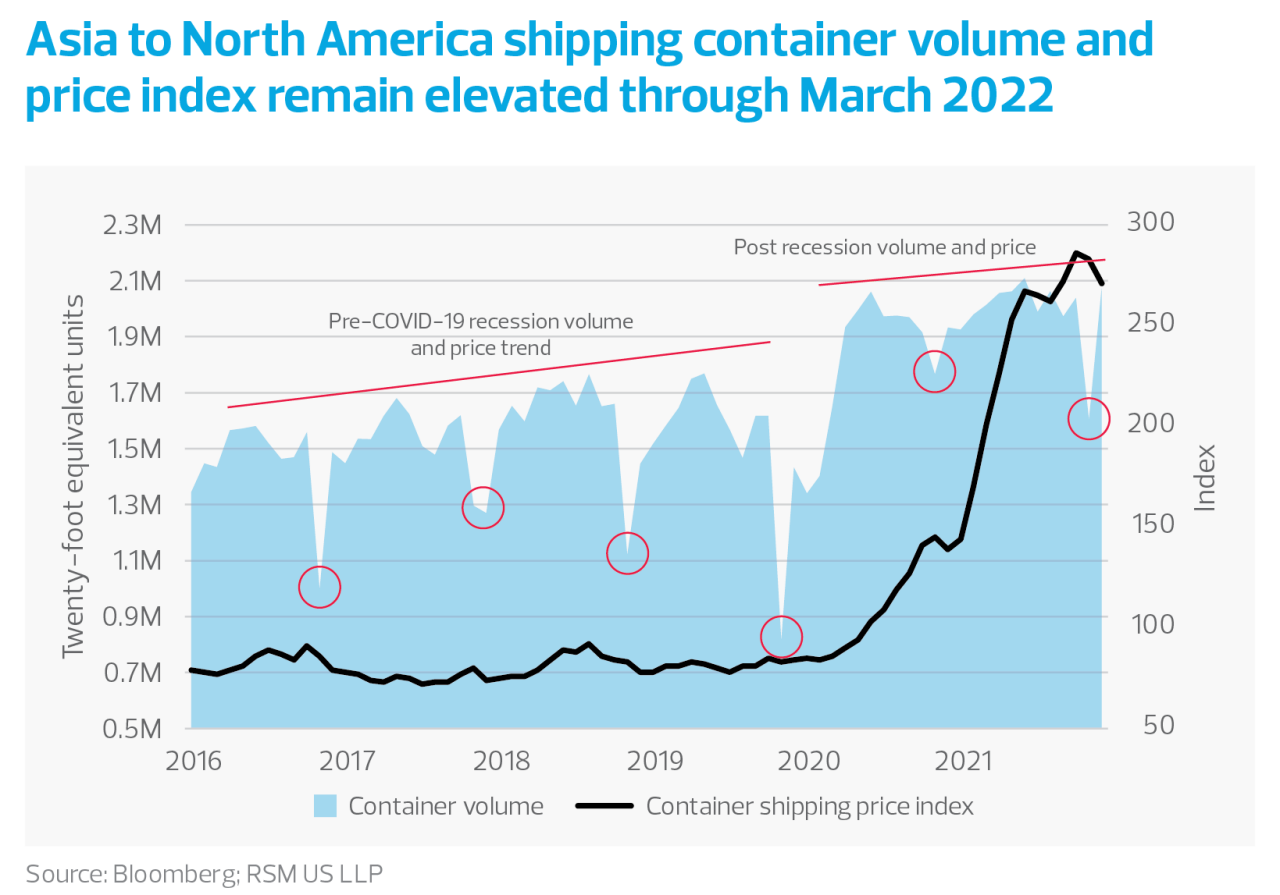
Beyond the West Coast ports, the United States as a whole continues to see higher-than-normal container volumes. Elevated container volumes worldwide have led to the highest container shipping prices in history. Even as spot rates in Asia have eased from highs late last year, they remain five times above pre-COVID-19 levels. Sending a 40-foot container from Shanghai to Los Angeles was listed at $8,587 at the end of April versus $1,654 at the start of 2020, according to the Drewry World Container Index.
In early November 2021, the Pacific Maritime Association instituted a new system requiring ships heading toward Los Angeles and Long Beach ports to call ahead of their approach. The result is fewer ships loitering at anchor within sight of shore and significant numbers motoring just over the horizon awaiting their turn. While reducing congestion and pollution nearer to shore, the new rule has done little to reduce the overall logjam.
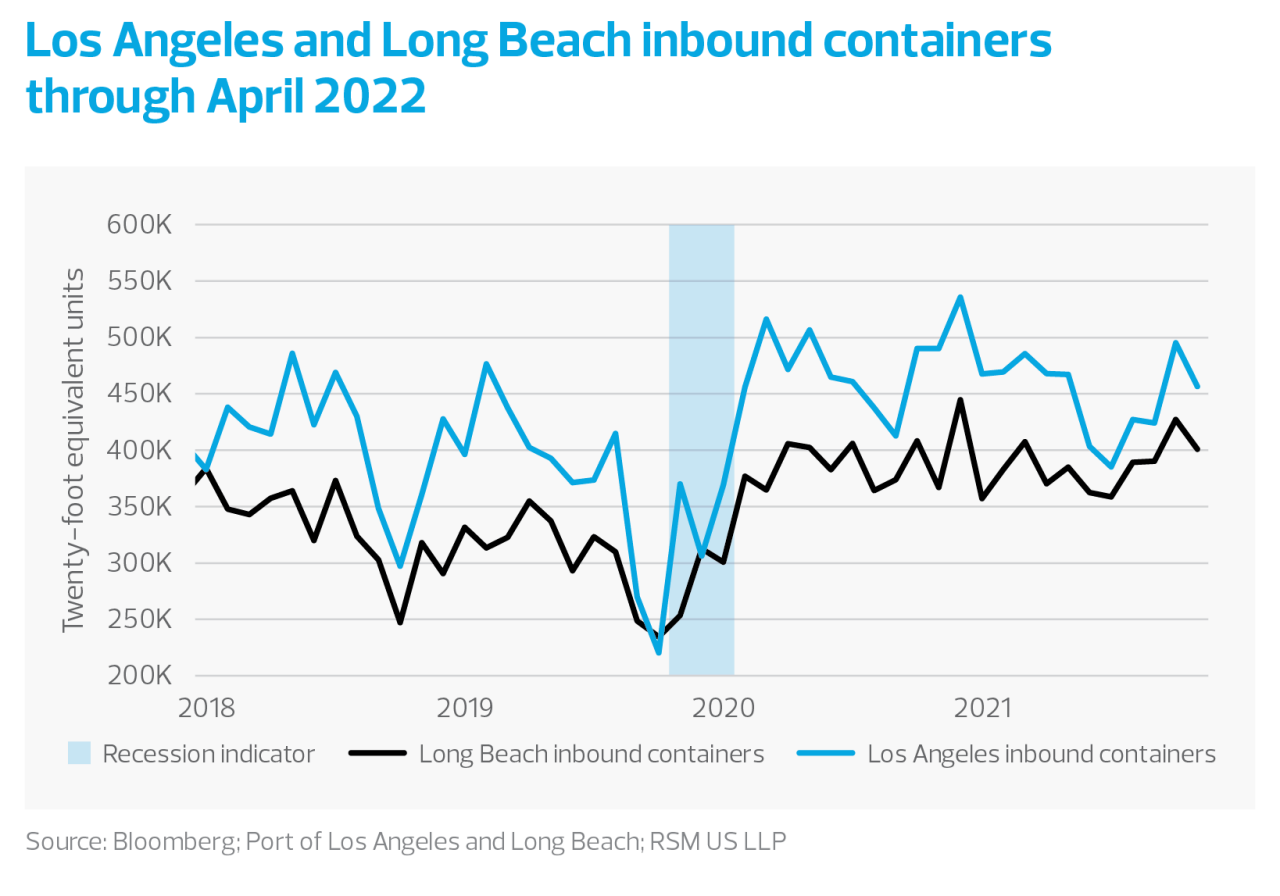
In March, the Long Beach and Los Angeles ports were again approaching their highest peaks of inbound containers since before the pandemic at 922,476, compared to 544,226 in March 2019, according to data published by each port and distributed by Bloomberg.
Alternate transportation methods
Several Asian ports are bigger, newer and more efficient than their U.S. counterparts, and it will take time for the United States to catch up. A 2020 Container Port Performance Index prepared by the World Bank and IHS Markit ranked Long Beach No. 333 and Los Angeles No. 337 in overall worldwide performance. By comparison, Shanghai ranked No. 47, while ports in China's Pearl River Delta collectively ranked No. 29. This U.S.-China disparity creates a capacity mismatch. Meanwhile, efficiency at U.S. ports also hinges on successful contract negotiations for 22,000 West Coast dockworkers, which need to be settled before July 1. Smooth talks with the International Longshore and Warehouse Union could help prevent port backlogs from worsening.
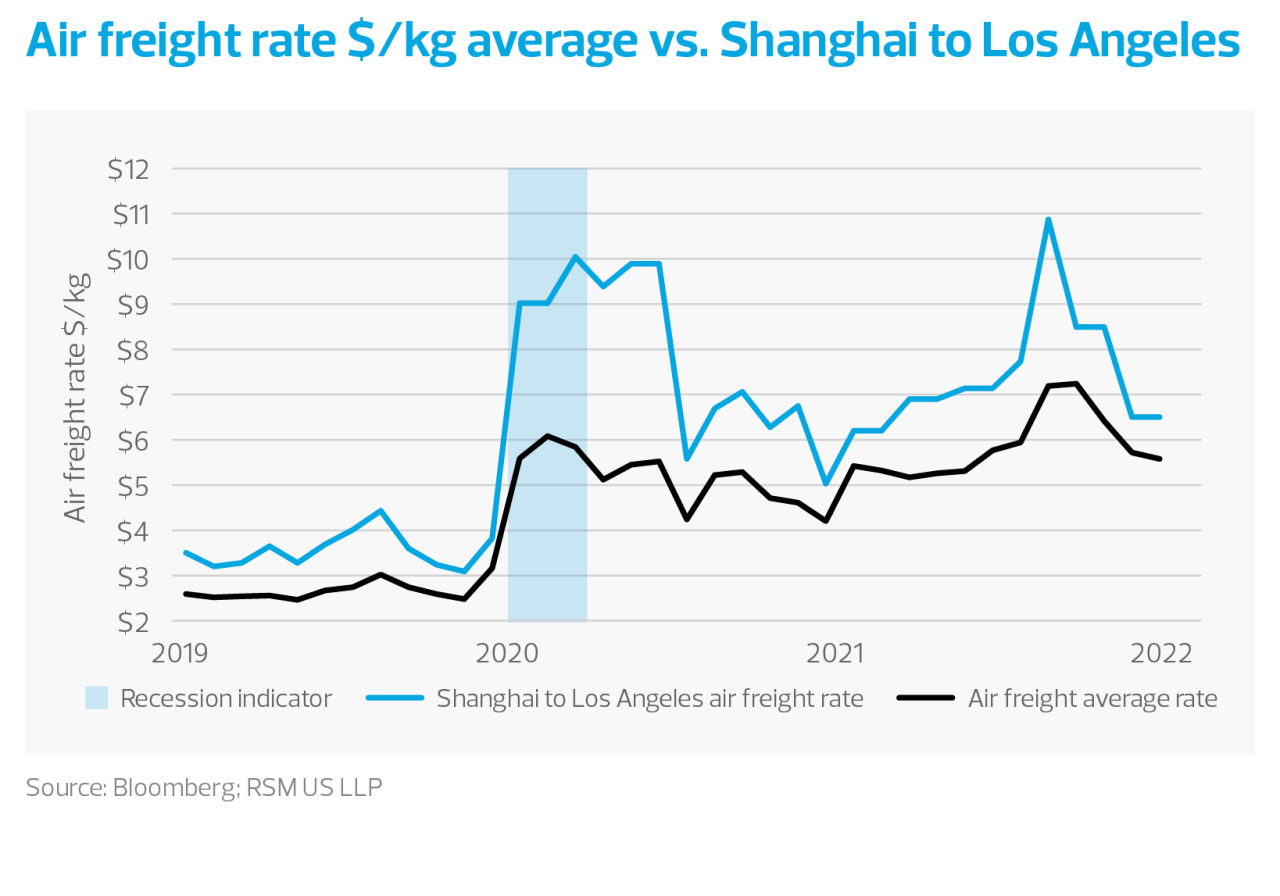
Meanwhile, U.S. businesses across all sectors are exploring alternative means of transport. Price indices for one option, air freight, were trending downward in February but held firm in March. April may see price increases due to higher costs for jet fuel, which reached $4.22 per gallon at the end of March, up from $2.76 the prior month.
In short, pricing for air freight is expected to remain above pre-pandemic levels; carriers don't eat the added costs and easily pass them through to customers due to well-established and frequently updated fuel surcharges.
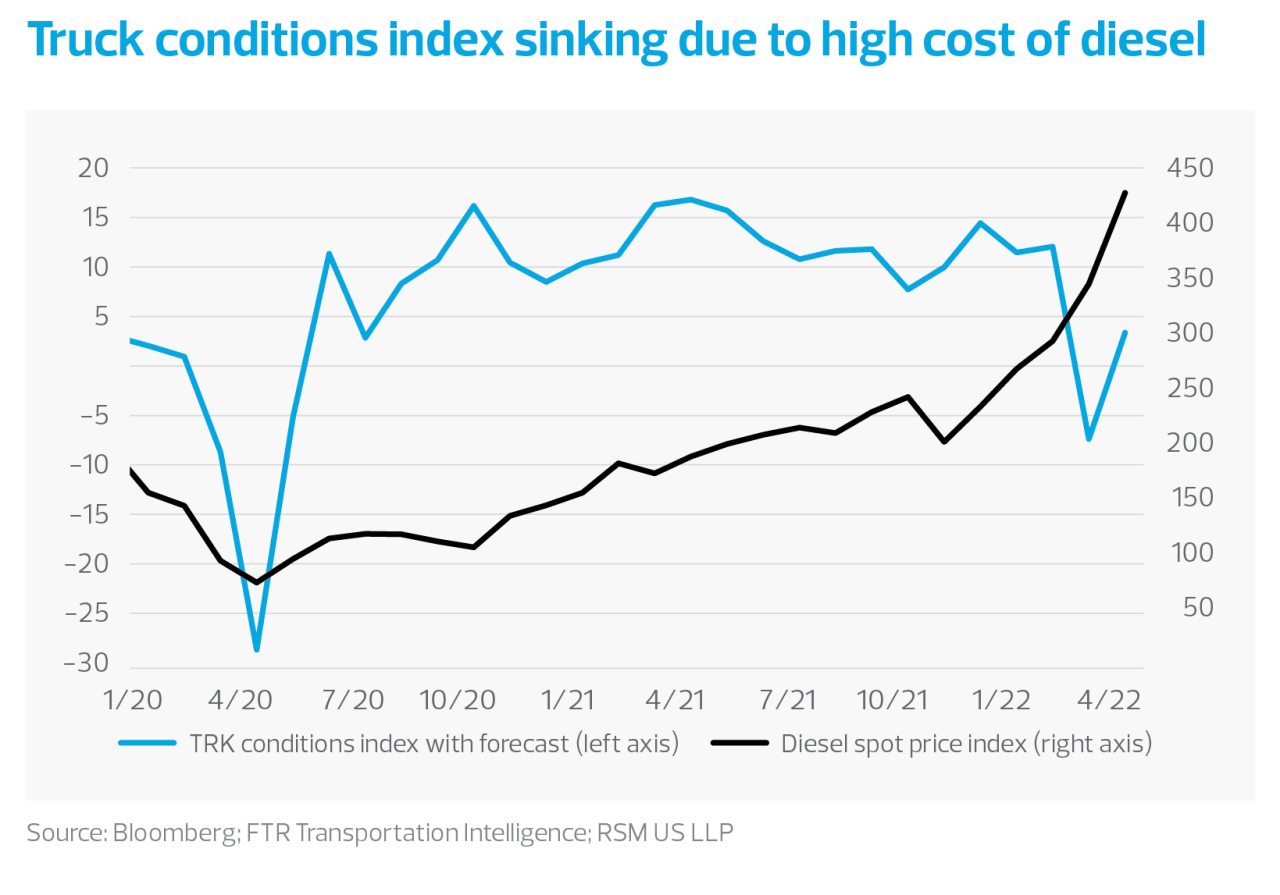
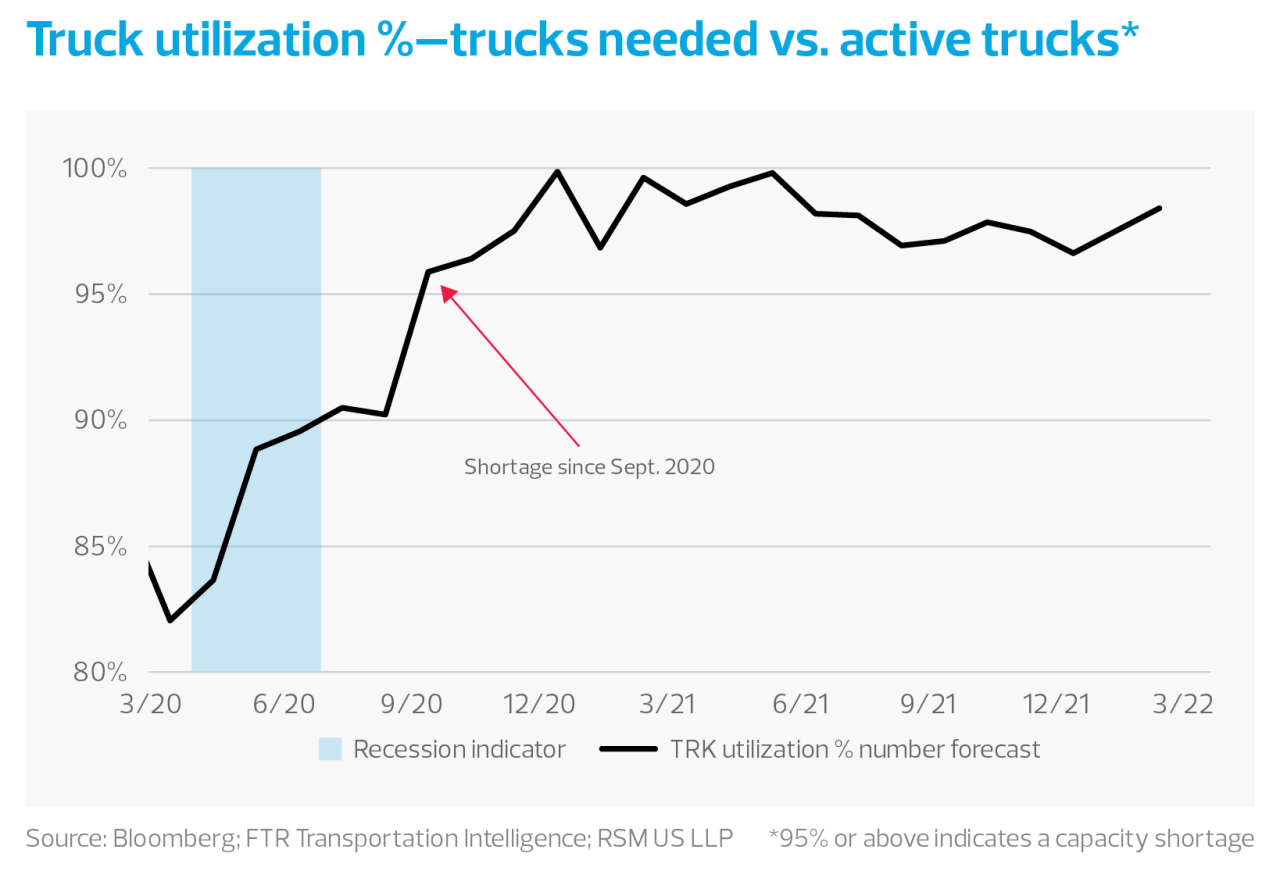
While trucking is no substitute for direct maritime routes, businesses are now leaning more heavily on this mode of transport, boosting demand and throwing another wrench into logistical logjams. According to FTR, a transportation intelligence firm, truck utilization rates show a shortage since October 2020. The pending wave of incoming containers at the ports will result in additional shortages, either sustaining rates or pushing them higher.
Adding to upward pricing pressure is the high cost of diesel fuel and the ongoing shortage of qualified drivers. Diesel costs hit $4.27 per gallon at the end of April, up from $1.42 in February 2020, before the pandemic.
The trucking labor erosion adds to the industry's challenges. Pandemic restrictions led to the exit of some nondomestic drivers and slowed the testing of new ones, according to a recent report from Gartner. At the same time, the pool of younger applicants is waning amid poor working conditions and a lack of work flexibility. Roughly two decades ago, the drivers' age was evenly split above and below 45. In 2021, the mix had skewed significantly older, with 65% over 45.
Some 1.89 million trucking companies operate in the United States, and more than 91% have six or fewer trucks, according to the U.S. Department of Transportation. Margin pressure on these smaller companies is particularly acute because they can't pass on higher fuel costs to customers and buy diesel at the pump. Unlike their larger counterparts, they are unable to buy diesel wholesale and bill fuel surcharges to customers. These smaller operators may be forced off the road at a time when demand is still near its peak.
Economic knock-on effects
Continued pricing pressure on the transportation sector will remain one of the key drivers of inflation. Unless the United States experiences a significant slowdown in economic activity going into the second half of the year, continued upward inflationary pressure from the sector is expected.
For more information on the supply chain, preview our 2022 MMBI supply chain report.
Let's Talk!
Call us at (800) 627-0636 or fill out the form below and we'll contact you to discuss your specific situation.
This article was written by Matt Dollard and originally appeared on Jun 07, 2022.
2022 RSM US LLP. All rights reserved.
https://rsmus.com/insights/economics/another-round-of-supply-chain-bottlenecks.html
RSM US Alliance provides its members with access to resources of RSM US LLP. RSM US Alliance member firms are separate and independent businesses and legal entities that are responsible for their own acts and omissions, and each is separate and independent from RSM US LLP. RSM US LLP is the U.S. member firm of RSM International, a global network of independent audit, tax, and consulting firms. Members of RSM US Alliance have access to RSM International resources through RSM US LLP but are not member firms of RSM International. Visit rsmus.com/about us for more information regarding RSM US LLP and RSM International. The RSM logo is used under license by RSM US LLP. RSM US Alliance products and services are proprietary to RSM US LLP.
Lewis, Hooper & Dick, LLC is a proud member of the RSM US Alliance, a premier affiliation of independent accounting and consulting firms in the United States. RSM US Alliance provides our firm with access to resources of RSM US LLP, the leading provider of audit, tax and consulting services focused on the middle market. RSM US LLP is a licensed CPA firm and the U.S. member of RSM International, a global network of independent audit, tax and consulting firms with more than 43,000 people in over 120 countries.
Our membership in RSM US Alliance has elevated our capabilities in the marketplace, helping to differentiate our firm from the competition while allowing us to maintain our independence and entrepreneurial culture. We have access to a valuable peer network of like-sized firms as well as a broad range of tools, expertise and technical resources.
For more information on how Lewis, Hooper & Dick, LLC can assist you, please call 1-800-627-0636.